

Scott Dennstaedt, PhD
-
Posts
456 -
Joined
-
Last visited
-
Days Won
3
Content Type
Profiles
Forums
Blogs
Gallery
Downloads
Media Demo
Events
Everything posted by Scott Dennstaedt, PhD
-

Foreflight vs Garmin Pilot
Scott Dennstaedt, PhD replied to hubcap's topic in Miscellaneous Aviation Talk
I have been using GP for quite some time now and while I have some gripes about the weather elements, I find that the features are perfect for what I need. -
(yet another) "FLYING" magazine rant . . .
Scott Dennstaedt, PhD replied to 76Srat's topic in Miscellaneous Aviation Talk
Well, you can still read all of my articles in FLYING since they are eventually posted online. -
Our good friends at SiriusXM Aviation are sponsoring a 60-minute free webinar on Tuesday, May 13th at 7 pm EDT. I will be providing the answers to frequently asked questions about aviation weather. If you are interested in attending, please register here. If you want to submit a question about aviation weather, please send it to aviation.support@siriusxm.com. Lastly, please spread the word! Hope to see you there.
-
TAF Timeline Visualization Tool
Scott Dennstaedt, PhD replied to flipfloppity's topic in Miscellaneous Aviation Talk
Thanks Paul for the shout out! Most of the heavyweight apps and other websites out there just throw data at you to see what sticks. This makes it very cumbersome for pilots that have a difficult time consuming this weather guidance. I didn't want to take that approach and felt it was necessary to develop at tool that identifies and quantifies personal risk...since that's the ultimate goal when we are doing our briefings. Here's a video that shows how I do a preflight planning session. -
Yep, it only takes one mistake to ruin your day.
-
What I like about this as well...is that you caught your three mistakes. The issue occurs when you don't.
-
For those interested in personal weather mins, I'll be doing a presentation at SUN 'n FUN on Thursday, April 3rd at 10 a.m. in room CFAA-01. This will also cover how I've integrated personal weather mins into my progressive web app which is designed to identify and quantify personal risk for a route. Hope to see you there! Also, check out this article from FLYING magazine that I wrote last year about personal weather mins.
-
NWS ending support of AIRMET
Scott Dennstaedt, PhD replied to Marc_B's topic in Miscellaneous Aviation Talk
It’s actually been in the works for nearly two decades as I discussed in my blog… https://www.avwxtraining.com/post/the-end-of-airmets-finally- 1 reply
-
- 1
-

-
Skew-t log p diagrams missing
Scott Dennstaedt, PhD replied to laytonl's topic in Miscellaneous Aviation Talk
Just be very careful here. WS is scientifically invalid especially as it relates to clouds. It uses a very rudimentary RH scheme for clouds using the GFS model which is not a convective-allowing model. In my app I used a concept called cloud fractions that does extremely well by blending together multiple forecast models (that are convective-allowing) to produce the vertical route profile that is scientifically valid. -
Skew-t log p diagrams missing
Scott Dennstaedt, PhD replied to laytonl's topic in Miscellaneous Aviation Talk
I developed a rudimentary sounding about six years ago. I do a lot of litigation support and weather forensics for wrongful death law suits and needed a way to build soundings from archived model forecasts. So, I am pulling this into my app and adding a few features that you won't find anywhere else. I am not a fan of Windy. They have everything based on single models and that's just not the right approach in my opinion. My app blends multiple models and provides a much more consistent forecast. Also, their Skew-T (last time I looked at it) doesn't show the various indices that I normally use. They also only provide the surface-based parcel and don't give you any info about the most unstable or mixed layer parcel. -
Skew-t log p diagrams missing
Scott Dennstaedt, PhD replied to laytonl's topic in Miscellaneous Aviation Talk
The reason the NOAA site was retired was not because of any accessibility issues or even because the agency that manages the site is a research organization and does not want people to rely on it for making decisions. If that were true, they would have shut this site down as well which is the same organization (GSL) that hosted the runsoundings site. Even this other site does say, "PLEASE NOTE: The information on this website is for RESEARCH PURPOSES ONLY. No data from this site should be used to make decisions related to the safety of life and property. There is no guarantee that data will be updated or that any product will continue to be available." Recently, I have seen at least five or six other gov't weather sites that I use regularly get shut down as well (for similar reasons). There are definitive plans to shut down even more gov't weather sites as we move into the next administration. The rucsoundings site was simply low-hanging fruit and much easier to be "retired" as they suggest. So I decided to take the opportunity to develop my own Skew-T diagrams that have features that are more robust than you can find on windy or most any other site...that's assuming they don't remove access to the data that I am using to populate the diagram. -
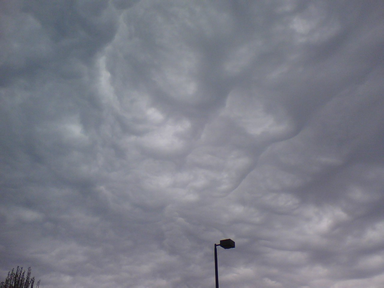
Actually flew on the day I took this pic. Quite smooth.
-
More specifically, undulatus asperatus clouds.
-
AI Enhanced Weather Forecast
Scott Dennstaedt, PhD replied to RoundTwo's topic in General Mooney Talk
Yes, two decades ago, the computing power was the limiting factor. However, with the emerging technology of quantum computing, this is now on a more level playing field. I am writing a piece for FLYING magazine that should be published next year that will discuss this topic a bit more with regard to weather forecasting. -
AI Enhanced Weather Forecast
Scott Dennstaedt, PhD replied to RoundTwo's topic in General Mooney Talk
Who remembers neural networks? It wasn’t all that long ago that the topic of neural networks was front and center in the world of weather forecasting. That soon ran into a dead end given the computing resources at the time were not sufficient to solve these difficult problems. Therefore, weather forecasting and AI have a substantial hill to climb. -
AI Enhanced Weather Forecast
Scott Dennstaedt, PhD replied to RoundTwo's topic in General Mooney Talk
Yes, and no. The prog chart is a forecast for pressure centers, fronts, surface pressure troughs, isobars, etc. The EZWxBrief progressive web app does not provide a higher temporal resolution for what you can find on the WPC or AWC site. It does provide an hourly weather type forecast that you can find on the station markers layer on the map for the next 72 hours. It does not use AI, but uses an advanced technique to blend the forecasts from 30 different deterministic, statistical and ensemble forecast models. Once a route is defined, it can quantify your personal risk for the next 72 hours based on the forecast weather that is along the route. The result of this assessment is depicted on the EZDeparture Advisor™ using the pilot's personal weather minimums. This is also reflected in the route profile view that has a 10 minute temporal resolution. -
AI Enhanced Weather Forecast
Scott Dennstaedt, PhD replied to RoundTwo's topic in General Mooney Talk
Yes, it could be done, but not easily. There are many technical factors that need to be considered to make it scientifically accurate. Much of this has to do with how probabilistic forecasts are presented. I published a blog post some time ago about prog charts that you can read here. It may show you the challenges that would need to be overcome. -
If you are interested in hearing about the weather forecasts along the path of totality for The Great North American Eclipse of 2024, then you should check out my YouTube channel. I discuss a pro-tip in the first two videos and I have a playlist here. These will be updated daily through Friday. On Saturday I am headed down to SUN 'n FUN to set up my booth in the Innovation Showcase tent (that is air conditioned!). So if you are going, stop by and say hello in booth IS-21. I'll be doing eight presentations as well.
-
- 1
-
-
Phantom Weather Indication
Scott Dennstaedt, PhD replied to Glen Davis's topic in Avionics/Panel Discussion
It's hard to see from the picture exactly where and when this is. Are you using SiriusXM or FIS-B? It could be virga if the air was fairly dry below the cloud base. It could also be ground clutter or anomalous propagation from NEXRAD. Need more info from you in order to help identify what might be going on. -
New AWC site is now live
Scott Dennstaedt, PhD replied to Scott Dennstaedt, PhD's topic in Miscellaneous Aviation Talk
That's correct...and if the code is designed properly, there are generally little issues and you get compatibility across the different platforms. For now, most browsers support PWAs, so it creates the look and feel of a native app without the costs involved. -
New AWC site is now live
Scott Dennstaedt, PhD replied to Scott Dennstaedt, PhD's topic in Miscellaneous Aviation Talk
With my PWA, I don't need any native operations like some of the heavyweight EFBs use. In fact, many apps (probably a majority of them) that you download from the App Store are just regular web apps with a wrapper. -
New AWC site is now live
Scott Dennstaedt, PhD replied to Scott Dennstaedt, PhD's topic in Miscellaneous Aviation Talk
Here's what I wrote up when I decided to launch my site as a PWA instead of a native app. You also have to deal with the orientations of smaller devices like an iPhone in both orientations. When you have a browser in landscape, the address bar takes up valuable space that you may want to utilize for other buttons/selections. https://www.avwxtraining.com/post/the-scoop-on-progressive-web-apps-pwas-ezwxbrief -
New AWC site is now live
Scott Dennstaedt, PhD replied to Scott Dennstaedt, PhD's topic in Miscellaneous Aviation Talk
What complexity are you referring to? You simply install this as a PWA and you are done. It just adds an icon to your desktop or home screen and you can launch it just like any other native app. Again, how complex is that? It's actually quicker than searching and downloading from the App Store. And when there are updates, they become available immediately and there's no need to interact with Apple or Google to get those updates Again, I see that as "less" complex, not more. -
New AWC site is now live
Scott Dennstaedt, PhD replied to Scott Dennstaedt, PhD's topic in Miscellaneous Aviation Talk
Read up about PWAs. You can use the site in the browser, but why not take advantage of the PWA so that the space on the device can be optimized? -
New AWC site is now live
Scott Dennstaedt, PhD replied to Scott Dennstaedt, PhD's topic in Miscellaneous Aviation Talk
The AWC doesn't have a native app that you will find in the Google Play or App Store. It's a progressive web app like I use for my site. PWA or not, their site is horrible on portable devices like the iPhone. It crashes way too often and just is hard to navigate.