
Scott Dennstaedt, PhD
-
Posts
456 -
Joined
-
Last visited
-
Days Won
3
Content Type
Profiles
Forums
Blogs
Gallery
Downloads
Media Demo
Events
Store
Everything posted by Scott Dennstaedt, PhD
-
 I am not sure what you mean by this? They do more than put an X on the chart. Have you looked at their other guidance?
 -
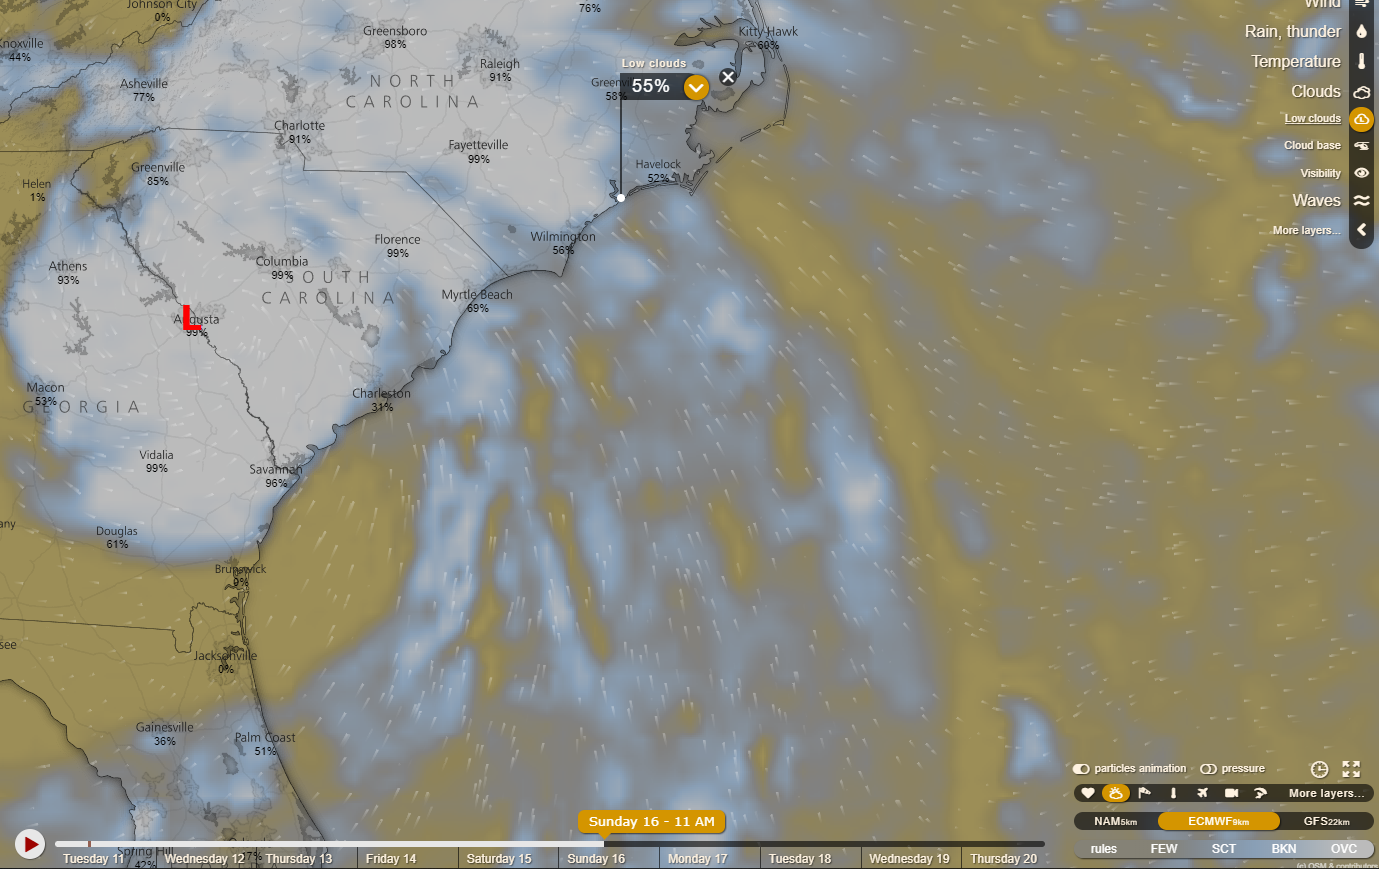
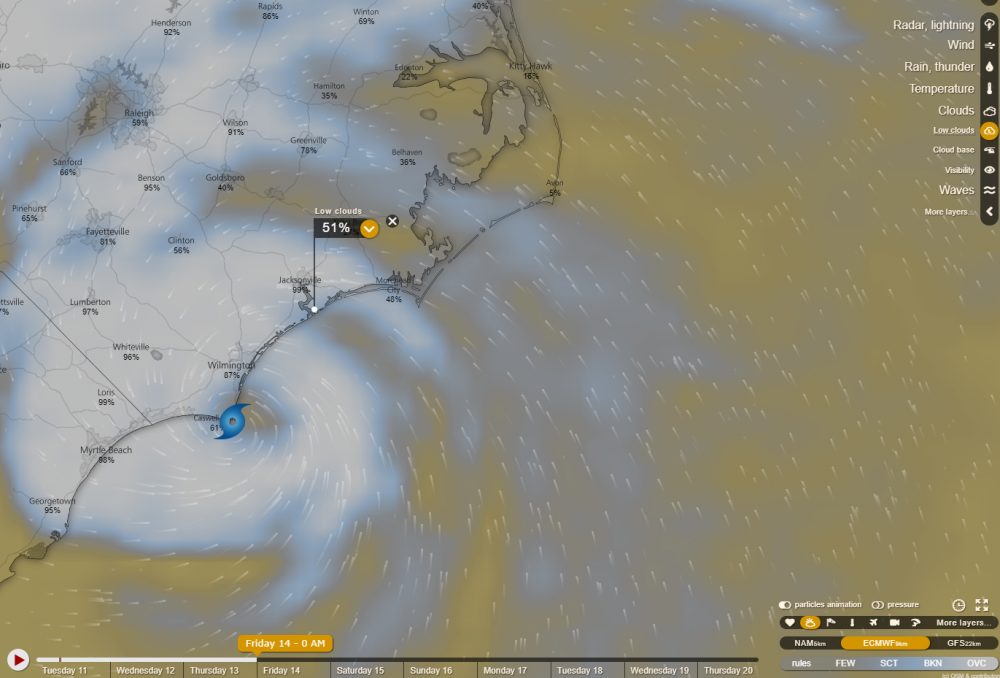
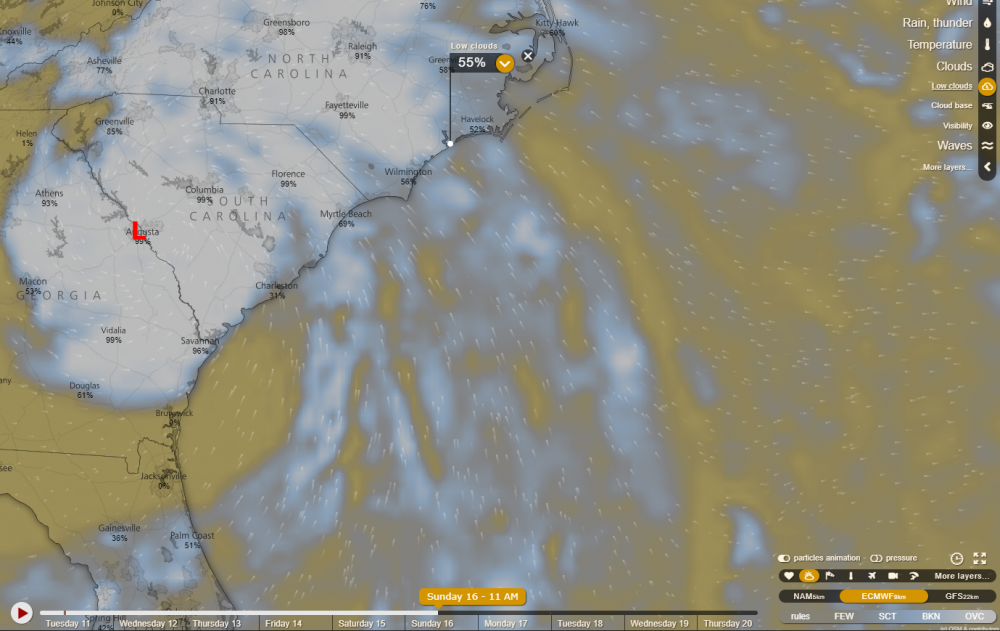
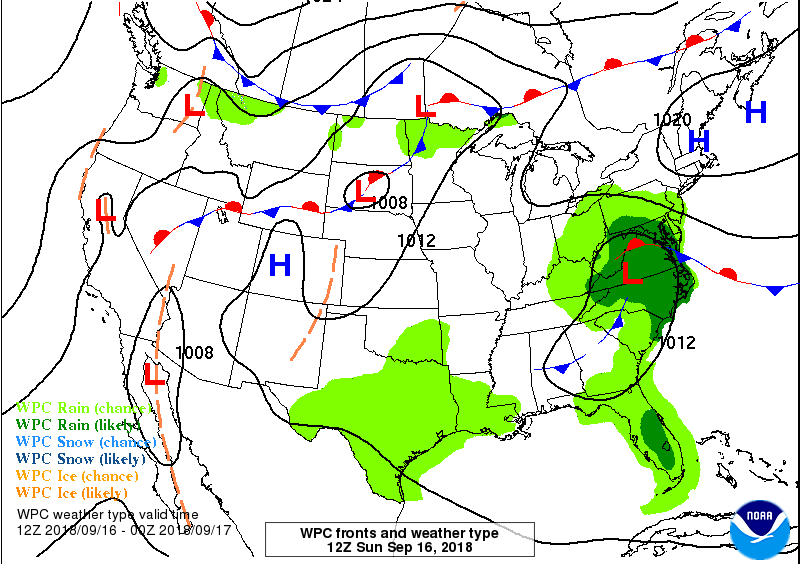
Windy is a tool that you can switch between models such as the ECMWF, NAM, GFS and NEMS models. I use some of the U.S. models because they provide a much higher temporal and spatial resolution than you can get with the ECMWF. Also, those models are used in products like forecast radar, CIP, FIP, GTG, etc that don't use the ECMWF. If you look at the ECMWF forecast right now for Florence, it is showing landfall at 12 a.m. on Friday much further south than the official forecast. The official forecast from the NHC is... Then the ECMWF has the track (remnants) headed toward Augusta, Georgia by 11 am on Sunday. The official track is for it to be in western Virginia by 8 a.m. on Sunday. So rather big differences in forecasts. The GFS now has the storm making landfall closer to the official location, but then stopping and moving northeast until looping back to the coast with a "second" landfall around Myrtle Beach, SC before heading northwest towards Florence, SC and Fayetteville, NC. Will the ECMWF be accurate within 15 minutes as you say? I doubt it - no model is that accurate or we would never use the other models. But only time will tell.

-
I created this 20 minute video to touch on some of the things you should know if you have any aviation interests in the path of Hurricane Florence. I hope you find this video useful. Feel free to post this elsewhere or send the YouTube link to anyone you think would benefit.
-
Very nice to hear....but what is really cool is that what you see with the app is literally just the beginning...we have a ton of other features planned that will make the current version look pretty parochial.
-
Yes, I am holding another live aviation weather workshop in the Houston area in two weeks...will likely do a similar WeatherSpork video series for that. I'll be posting these to the WeatherSpork YouTube starting as early as September 17th. I'm also doing a video series for pilots flying into the Las Vegas Cirrus Owners & Pilots Association Migration in October.
-
Second edition for those interested.
-
Go to https://app.weatherspork.com/ You will see the attached screen. Then Click on the "Need an Account?" button to sign up for a trial.

-
Yes, you can go to http://weatherspork.com and click on Login and you'll be able to create a trial account there. Most briefings are single threaded in nature. You tell the briefer (or via an online service) your flight plan which includes departure and destination airport, route of flight, altitude, duration of the flight and lastly, the estimated time of departure. You get a flood of data back at you and it might not look so good. What about 3 hours later? Or perhaps later in the afternoon? Maybe tomorrow morning? So you have to "hunt" using this time-consuming and error prone trial and error process that's been around for 50+ years. WeatherSpork has taken the time element and placed it front and center. I've said for years, I can teach you a lot about weather, but I'd rather school you on how to manage your schedule. We look at all possible departure times over the next three days and instantly lay this out in front of you so you can quickly see the ETD that minimizes your exposure to adverse weather. We are not an EFB. WeatherSpork is a tool that is complementary to the products you may currently use in the cockpit. We also have a training component as you can see from some of these videos, plus over 80+ bit-sized workshops within the WeatherSpork app that I personally created over the last 10 years to teach you how to recognize and understand adverse weather and the limitations of the guidance pilots use every day. WeatherSpork has the most comprehensive weather imagery available online that includes high resolution forecasts (at 15 minute intervals in some cases) to provide a situational awareness you won't get anywhere else.
-
Video series on weather analysis
Scott Dennstaedt, PhD posted a topic in Miscellaneous Aviation Talk
Over the next three weeks, I will be doing a video series for several fly-in events. Each series will include one or more videos showing you how to identify the adverse weather if you are planning to fly to any of these events. I did a similar series for those flying into AirVenture. The first video below is an analysis for those attending my Weather Essentials for Pilots live workshop in Williamsport, Pa. on September 8-9. Even if you are not flying to any of these events, I hope it'll be educational nonetheless. Please keep in mind that this is for educational purposes only and does not substitute for a formal preflight weather briefing. If you want to see the other videos in the series, please check our WeatherSpork YouTube channel or subscribe to stay updated. Enjoy! http://youtu.be/Ywej54sOCYQ -
Great to hear Paul. Got a lot of new features coming over the next 6 to 12 months.
-
Thanks a bunch Dan. That program has undergone three major revisions over the past 15 years and so I've put in almost 2000 hours developing it. So technically I'm still making less than minimum wage on the profits.
-
See https://www.faasafety.gov/SPANS/event_details.aspx?eid=85199 if you'd like to register to attend.
-
SiriusXM Radar and Lightning Twice as Fast
Scott Dennstaedt, PhD replied to Txbyker's topic in Avionics/Panel Discussion
Yes, the TWC is doing a fair amount of processing of the raw data, so what you see with a new update is actually fresher than the prior one. This is only for the composite reflectivity. It would be less useful for the lowest elevation angle though since the fastest volume coverage pattern is every 4.5 minutes in VCP 12 or 212. On average 1/2 the mosaic would update at 2.5 min and the other half would be the same as before - but it's be randomly distributed throughout the mosaic. -
SiriusXM Radar and Lightning Twice as Fast
Scott Dennstaedt, PhD replied to Txbyker's topic in Avionics/Panel Discussion
Paul, I know this is a somewhat older thread, but I did a presentation at AirVenture this past week that discussed this change to the SiriusXM (SXM) radar. My response is not directed at you in particular, but someone who attended my presentation asked me to comment here... This "twice as fast" catch phrase as SXM is using affects both lightning and the composite reflectivity mosaic. Just as a refresher, composite reflectivity examines the base reflectivity (dBZ, where Z is the reflectivity parameter) from every elevation scan in the volume coverage pattern (VCP). It then extracts the highest dBZ in each column over the radar coverage region. That could have been from the lowest base reflectivity elevation angle (lowest tilt) or the base reflectivity from one of the higher elevation angles. As I discussed in my presentation at AirVenture, the term "base" does not mean lowest as most pilots assume...every elevation angle has a base reflectivity product. To create a mosaic, the composite reflectivity from each radar site must be stitched together (there can be some nasty assumptions here with this process). As you might imagine, the WDR-88D NEXRAD Doppler radars are asynchronous. That is, one radar site may be scanning the atmosphere on the lowest elevation angle while a neighboring radar site may be scanning the atmosphere on the 4th elevation angle. There are many different scanning strategies depending on the type of weather expected in the area (severe, drizzle, snow, etc). Nevertheless, TWC (SXM's provider) doesn't care about the asynchronous aspect of the radars. They simply grab the last known complete base reflectivity scan from whatever elevation angle and count backwards in time from there until they've grabbed an entire "volume scan's" worth of data. For example, if the radar just completed the 4th elevation angle, they grab the base reflectivity from that scan and go back to elevation 3, 2, 1, 14, 13, ..., 7, 6, 5 to grab the base reflectivity from those scans. Perhaps a neighboring radar was finished the 7th elevation angle, they would grab 7, 6, 5, 4, 3, 2, 1, 14, 13, ..., 9, 8 and so on. In this case I'm assuming that every radar has 14 elevation angles per volume coverage pattern which is not always the case. So to get the twice as fast updates, they simply schedule this process above every 2.5 minutes. They could do it once a minute. But, both FIS-B and SXM are highly bandwidth challenged...you can only put so much data in the small pipe...and it has to be scheduled accordingly. Of course, any particular pixel you see on your display could have been from the oldest elevation scan or the newest. And yes there are delays in processing and uplink/downlink that occur. For lightning. At a scheduled time, TWC pulls all data collected in past 2 minutes and puts it into a file, which is then queued for SXM broadcast. Add 10 seconds of processing and queuing. All said, the lightning data a pilot would see could be anywhere from 25 sec to 2 min 55 sec old at reception in the cockpit. The age (I call this the virtual age) you see on some displays is based on the time of reception and not the age of the product. The natural age of the product varies as stated above. Of course, there could be other delays. For example, the software vendor could choose to hold that data for a period of time before displaying it (why that happens is a whole different discussion). Once received, you stare at that data for another 2.5 minutes until a new set of data is received. Therefore, moments before the next update is received, the lightning could be 2 min 55 sec to 5 min 25 sec old (although the "age" in the display may only say 2 or 3 minutes). Same is true of the radar mosaic. The faster refresh rate cuts down that stare time from 5 minutes to 2.5 minutes. The virtual age is based on the time of reception...once again, this could have been from the oldest elevation scan or the newest (you don't know). In a perfect world, the average natural age of the radar mosaic is 3.5 to 5 minutes old and then you stare at that image for 2.5 minutes now instead of 5. Also important to understand is that this radar mosaic is highly filtered. It's designed to show only those returns that come from actual hydrometeors. They attempt to filter out ground clutter and anomalous propagation, but sometimes it does get through. And in the worst case scenario, they can add a manual gross filter in a region where precipitation is highly unlikely where it filters out ALL returns...so if they fail to remove it in a timely manner, I've have seen them filter out real precipitation returns...even severe storms in some cases. It happens more often than they want to admit. That's why I always have lightning (and storm tracks) turned on...it's not part of that gross filter. By the way, the NWS is experimenting with lowering the lowest elevation angles for some radar sites. The lowest elevation angle is 0.5 degrees. This test will include dropping the lowest elevation to -0.2, 0 and +0.2 degrees. Since December 2017, the radar in San Francisco has already been operating at +0.2 degrees (MUX). Sorry for the length of this response, but I hope this helps clear a few things up...