
Scott Dennstaedt, PhD
-
Posts
454 -
Joined
-
Last visited
-
Days Won
3
Content Type
Profiles
Forums
Blogs
Gallery
Downloads
Media Demo
Events
Everything posted by Scott Dennstaedt, PhD
-
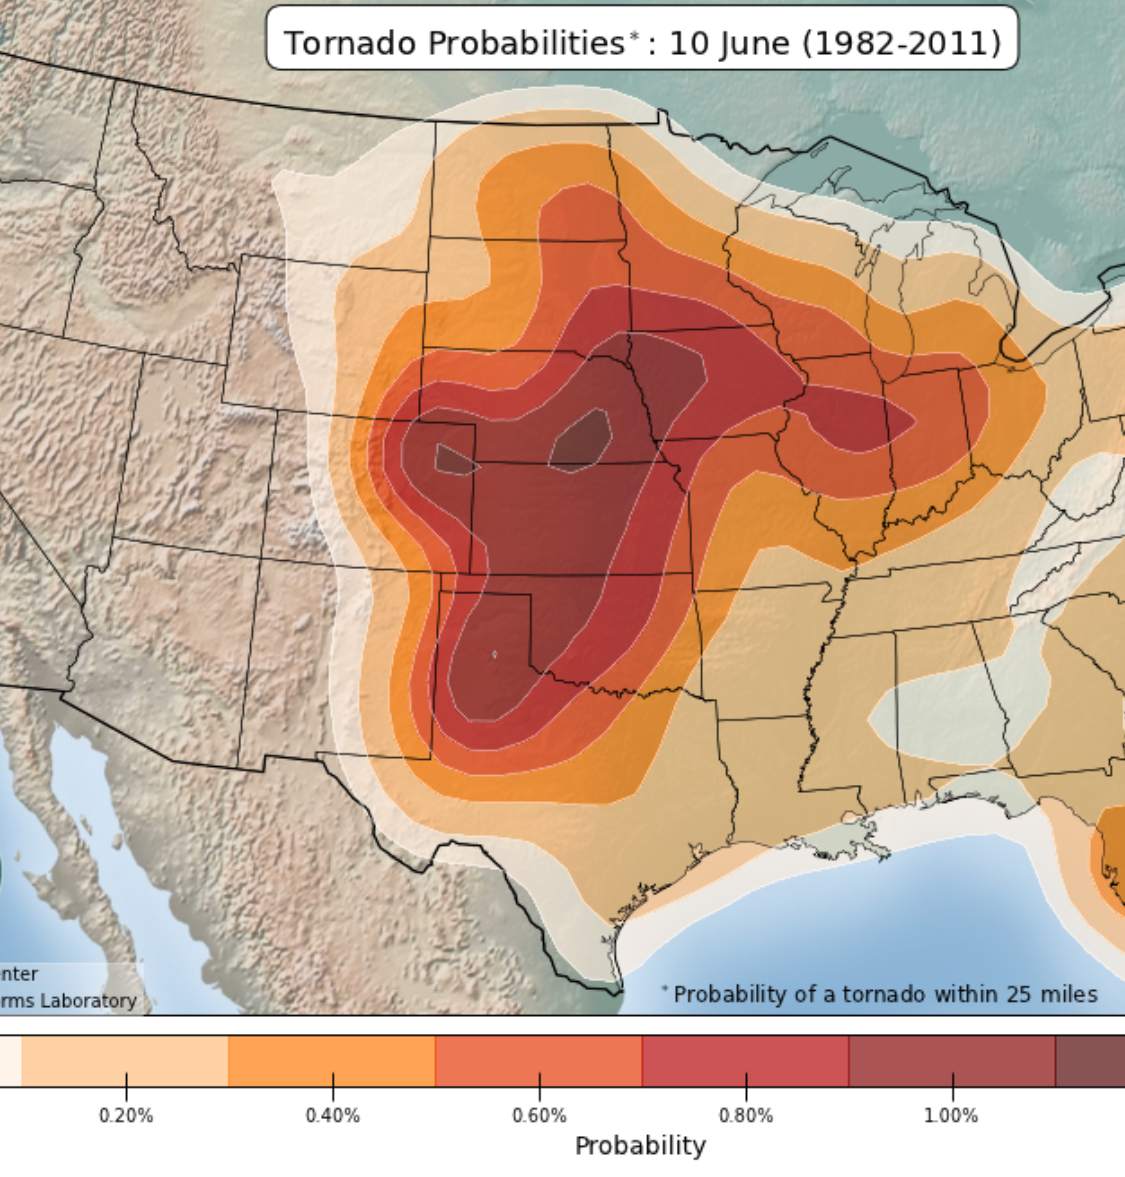
 Here’s the worse time of the year for tornadoes in the Great Lakes region.
-
Tornadic thunderstorms happen more often in the U.S. than anywhere else in the world. You need plenty of warm moisture (Gulf of Mexico and the Atlantic) to fuel these storms and you need atmospheric wind shear. March and April are transition months where we will see large outbreaks of severe convection that don't obey the conventional rules that it's best to fly in morning. As the jet stream moves further south from Canada during the spring, it provides the upper level support to energize the atmosphere. Given plenty of low-level boundary layer instability and moisture and an extreme change of wind with height due baroclinic (equator to pole) instability, you get severe weather. This kind of set up doesn't happen in many other locations around the world.
-
Art, The primary issue is that it happened in the overnight hours, not uncommon with large weather systems like this. Getting the word out in the middle of the night is much more difficult and it's hard to see these in the distance at night from a reporting perspective. The main focus was the western third of the state. The ensemble forecast models didn't pick the extreme threat near Nashville. However, the Nashville area had been in a slight risk area for severe weather with the primary threat to be tornadoes and hail. However, the overall intensity was missed in the Nashville area. This should have been a moderate or even high risk area. But none of the forecast guidance suggested the magnitude of the tornadoes in the Nashville area. I think this event will be well researched in the coming months or years. A tornado watch was issued for the Nashville area 1122 PM CST. Then as tornadoes developed, there were several severe thunderstorm and tornado warnings issued. This progression of events is normal, but the SPC typically wants those watches to go out much earlier than they did for this event.
-
Actually it's just the pure force of air against the structure that causes the damage, not an "explosion" due to pressure differences. The old wives' tale that says you should open the doors and windows to equalize the pressure is really the wrong approach. First, if your house doesn't get hit directly, it might suffer water damage. Second, you are taking valuable time when you should be seeking shelter. When you open a window or door on the windward side of the house or it gets busted out by debris, it actually weakens the structure by allowing air to penetrate the structure (like opening an umbrella on a windy day) and it'll literally get blown off of its foundation.
-
It's the simple fact the Northeast U.S. and parts of Canada (Nova Scotia) tend to experience very intense "bomb" mid-latitude cyclones that don't happen out over the Rockies. With Mount Washington being up in elevation vs other lower elevation observation stations (airports), it records these high wind events.
-
You should follow @MWObservatory on Twitter. They post pretty frequently when winds start jumping up above 100 kts. They even have "contests" to see if followers can guess the highest wind gusts. To answer your question, there's nothing special about Mount Washington here, pressure or otherwise. If you had a sensor twenty or fifty miles at that elevation in any direction you'd see the same wind speeds.
-
When it sticks up in the atmosphere at 6000 ft. Think about winds at 6K when flying. 100 knots is not unusual at that altitude in the Northeast.
-
Yep. Very correct.
-
KMWN 041452Z 27088G102KT 0SM -SHSN FZFG BLSN VV000 M09/M09 RMK PK WND 270116/09 LGT ICG Visibility: 0 statute miles Clouds: Indefinite ceiling 0 feet Weather: Light snow showers and freezing fog with blowing snow Wind speed: 88 knots Wind direction: 270° Wind gust: 102 knots Temperature: -9°C Dewpoint: -9°C Thank goodness...only light icing today.
-
My sweet spot in these kinds of situations would have been between 15K and 18K. The ride would have likely been pretty smooth. On descent it might have been a different story. I could see moderate or greater turbulence into Las Vegas. It was on the back side of a trough with a ridge building in from behind. That's the place I like to be.
-
This happened after sunset. It was likely more about moisture advection. Once that moisture source began to fade, so did the clouds. When you get even a small drop in moisture in those higher wind scenarios, it can mix out pretty quickly.
-
How many places have you seen go from 1/8SM to 130SM within an hour...not all that uncommon if you are at the Mount Washington Observatory. KMWN 210353Z 29030KT 130SM FEW/// SKC M25/M37 RMK TPS LWR FEW DSNT SW KMWN 210255Z 29033KT 1/8SM FZFG SCT000 M27/M27 RMK FZFG SCT000 VRY LGT ICG
-
FYI: At the end of March, the National Ceiling and Visibility Analysis (NCVA) product will be terminated. This is due, in part, to the modernization of NWS online resources and outdated satellite masking dependencies. Therefore, this product has become unsupportable and is considered no longer scientifically valid by the NWS.
-
Now that's some priceless advice.
-
Thanks! Oh, yes, the heat. In my early days as a flight instructor I can remember day after day at 2,000 ft and below enduring the heat of those warm summer days getting bounced around in thermal turbulence for hours at a time. Not fun.
-
Sure. It's not always about turbulence...icing, convection, IFR conditions, etc. are also something that I can usually avoid when altitude is flexible.
-
Correct on timing. However, for these short flights it's not as much about forecasts as it is about observational data. Learning to assess the upstream trends. The first few hours of a TAF, for example, are often more related to these trends than any short-term model forecast. Short flights you lose one of my favorite options...altitude. Climbing on top is usually not an option.
-
I like to see both. I want to know the story...that comes from looking at the forecast models (e.g., constant pressure charts) and learning what story Mother Nature is telling. Then, when I look at the "visualization" tools, then and only then can I understand why I should believe them. To look at them without that big picture is like driving down the road looking through a straw. Nobody would do that...so why should we do that with our weather planning?
-
I don't pay a lot of attention to the wind velocity. Strong winds don't equate to turbulence. Wind speed (and direction) is just one ingredient in the turbulence recipe. I've have flown over the Rockies dozens of times where the winds at the peaks were greater than 50 knots and the air was glassy smooth. The more significant bumps were near the surface where thermal turbulence takes over.
-
Paul, It's funny that you say that I'm a meteorologist and will analyze those charts...and then you launch into the fact that you look at windy and the ECMWF model. We are actually looking at the same thing...the big difference is that I'm likely squeezing more out of this than most, but that doesn't mean pilots can't learn how to do this. It's not all that difficult....and those folks that I've taught over the years will swear by it. Learning what a negative tilt to a trough means...or what a jet streak in the atmosphere means is quite important to explaining the weather you might face. The glance value of these charts are incredible. I've always thought the FAA missed the boat here not teaching pilots how to use these upper level charts.
-
You are welcome. I typically start with the surface analysis chart and then work my way to the prog charts, and spend most of my time on the 500 mb chart...then, depending on the time of year and location of the flight, I compare this upper-level picture to the convective outlooks/forecasts, precipitation forecasts and G-AIRMETs. Often with that overview I will typically begin to look for other times to fly...
-
Yes, a METAR gives you some concrete info so it's consumed easily. I agree that textual forecasts are certainly not the best approach. It's always interesting to see how pilots view certain products. I don't see NEXRAD as a big picture thing. It may help to explain the big picture (for the past), but it's not something I utilize heavily to understand what might happen over the next two to six hours. I like to focus on those prog charts...but I tend to focus on not just the surface, but use constant pressure charts to define where the real energy is in the atmosphere. How those upper-level features evolve gives me the information I typically use for a go or stay decision. I love the G-AIRMETs. I don't see them as crying wolf at all - but you understand their limitations...in fact, they tend to drive my decisions about route and/or altitude more than anything else. For TAFs and METARs I rarely spend more than a few minutes looking at those. I draw some important "key words" from those and apply that to the big picture. I tend to use TAFs more for alternate selection (plan B or C). In fact, when I do a 1-on-1 training session with pilots we spend about an hour going over the trip and rarely get time to discuss these. Most of the time, they end up being less important once you see all of the big picture details.
-
I'm actually doing my own study right now as I'm working to finish my PhD. And it turns out that it doesn't really matter. In fact, it's amazing how little pilots are taught these days about how to look at the big picture. CFIs still tend to gravitate to the METARs, TAFs, PIREPs...all of those "details" and less focus on the big picture. So pilots don't really know any better. Yes, the availability is there for all of these big picture products, but the right approach to using the big picture is never taught. I'm writing a journal paper right now and for VFR into IMC accidents (the most deadly of any causal factor) a majority of these accidents are during the cruise phase of flight. Recent studies have shown that pilots tend to focus on the wx at the departure and destination airports and less on the en route phase largely because they fail to spend enough time on the big wx picture.
-
Perhaps, but from my perspective, my procedure isn't much different. Yes, there's more ground to cover and potentially more weather to deal with...but if I think back to some of the most intense weather planning I've done in the last 20+ years, it's been on very short flights (less than 100 miles). For me, short or long flights, that big picture is the key to making a safe flight. My decisions to go or stay typically come from this.
-
I'm guessing this was on an approach to land or for a departure, not any kind of cruise altitude per se. Here's a tip for everyone. When filing a PIREP for ice (or turbulence), be sure you give the altitudes or range of altitudes you were accreting ice or experiencing turbulence. Don't just say, "icing on climb out". That's because the Current Icing Product uses our PIREPs to help it do a better analysis. And "icing on climbout" with a FL016, for example, would just strengthen the icing potential at 1600 ft MSL, not through the range of altitudes experienced.