
Theo
-
Posts
149 -
Joined
-
Last visited
Content Type
Profiles
Forums
Blogs
Gallery
Downloads
Media Demo
Events
Everything posted by Theo
-
19A - KLKR 7/8/09 Smooth as glass ... what a way to travel!
Theo posted a gallery image in Old MooneySpace.com Images
From the album: Trips
-

From the album: Trips
-
19A - KLKR 7/8/09 Into the early morning sun
Theo posted a gallery image in Old MooneySpace.com Images

From the album: Trips
-

From the album: Trips
-
19A - KLKR 7/8/09 Destination marginal .... these are Rays Of Hope!
Theo posted a gallery image in Old MooneySpace.com Images

From the album: Trips
-
That is sweet! One of the best I have seen in a while. I especially like the way the tail numbers look ... sort of blended into the paint scheme instead of detracting from it.
-
I have heard great things about Tim in Lafayette, GA. That isn't too far via Mooney. I went there once to get a VOR indicator fixed and he took care of it for free. He told me to come back when I needed something big! He is a former Mooney owner and has put S-Tec's in several Mooneys. Gann Aviation, Inc. Airport: Barwick Lafayette Airport (9A5) Address: 120 Gasque Drive City: Lafayette State: GA Zip Code: 30728 Country: United States Telephone: 706-638-7921 Fax: 706-638-1074 Contact: Tim Mathison Email: gannaviation@msn.com Web Site: http://www.gannaviation.com
-
Thanks for the suggestion. I will add the mixture check to the squawk list for annual this winter. We have gone over the baffling and cowl flaps with the local mechanic and at Joey Coles a couple of years ago when he did a new top, but that is worth another look too I suspect. I am useing a JPI EDM-800. It does read a bit higher than the factory guage on #3 where there are two probes. It is #4 that usually wants to get too hot though. If all I had was the factory guage I wouldn't even know about it. I have always thought it was interesting that in Bob Kromer's test flight article from 2000 he had near red line CHT for a some of his climb. This sort of led me to think it was the nature of the beast in some respects. I assume he was just using the stock guage on #3. Makes me wonder what the other three cylinders were doing. Bob's test data: Continuous Climb Data 1966 M20C N3411X Full throttle, 2700 rpm, mixture leaned to 100-125 degrees rich of peak, cowl flaps open, airspeed as noted Elapsed Time Altitude MIAS MP RPM Oil Temp CHT OAT Rate of climb* Climb#1 Airspeed at Constant 100MIAS 0:00 1000' 100 27.8 2700 200 400 97 --- 1:02 2000' 100 26.9 2700 200 440 92 968 2:40 3000' 100 25.9 2700 205 440 89 612 3:57 4000' 100 24.9 2700 205 430 84 779 5:08 5000' 100 23.9 2700 205 415 81 845 6:30 6000' 100 23.0 2700 200 415 79 732 8:04 7000' 100 22.1 2700 200 420 73 638 9:47 8000' 100 21.2 2700 200 415 69 582 11:37 9000' 100 20.4 2700 200 415 64 545 13:42 10,000' 100 20.0 2700 200 415 59 521 Elapsed Time Altitude MIAS MP RPM Oil Temp CHT OAT Rate of climb* Climb#2 Airspeed at Constant 120MIAS 0:00 1000' 120 27.8 2700 205 410 98 --- 1:00 1800' 120 27.0 2700 205 425 96 800 2:00 2550' 120 26.2 2700 205 430 92 750 3:00 3480' 120 25.2 2700 205 425 88 930 4:00 4080' 120 24.7 2700 205 425 82 600 5:00 4860' 120 24.1 2700 205 425 79 780 6:00 5570' 120 23.2 2700 205 420 74 710 7:00 6250' 120 22.9 2700 205 415 72 680 8:00 6680' 120 22.4 2700 205 410 70 630 10:00 8680' 120 21.7 2700 205 405 65 500 12:00 8950' 120 21.9 2700 205 405 60 270 14:00 9320' 120 20.1 2700 200 405 56 335 15:46 10,000' 120 19.7 2700 200 405 54 385 * Under perfect flight test conditions, rate of climb should decrease smoothly as altitude increases. However, the air was very turbulent on our day of the test, so that is the reason why the numbers don't decrease evenly. Nevertheless, this test was a good one for 'real world' conditions and is pretty representative of what a C model will do on a hot day.
-
The CHTs have always been boarderline high on my M20C. Enough so to require step climbs for cooling after a fuel stop, but not really an issue on the first take off of the day. I have sealed the dog house up and had several mechanics look at it - plus it has done this on three different sets of cylinders! - so I am thinking about adding the cowl closure mod. Has anyone on the forum done this and noticed a difference in CHT reading?
-
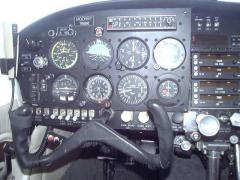
Hello all .... Theo Bellamy - Charlotte, NC - I am on my second Mooney, a 1965 M20C that I keep in Lancaster, SC KLKR. I have been flying Mooneys off and on for about 25 years and hope to keep it up for another 25! I have a collection of early Mooney panel mod photos that I put up in the photo gallery. I did the panel on my first Mooney back in the 80s but my current bird still has the "vintage" layout. I am about used to it and may not change ... but I still collect panel photos anyway. Go figure. Nice to find there is modern Mooney forum online now. Nice work Craig!
-
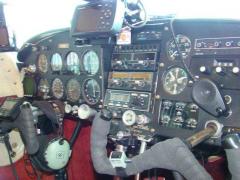
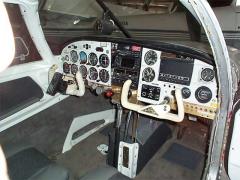
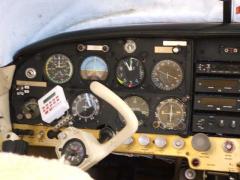
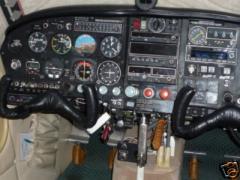
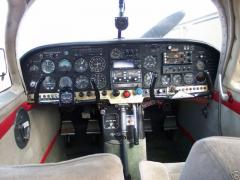
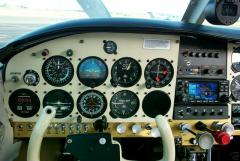
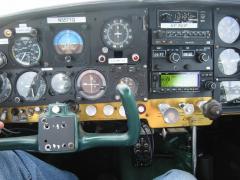
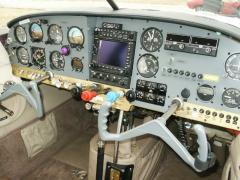
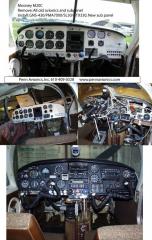
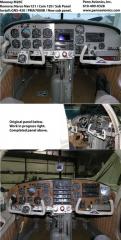
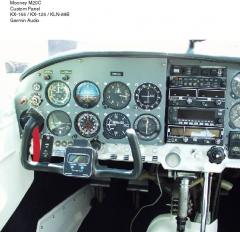
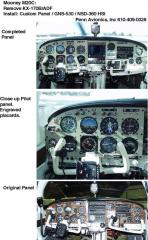
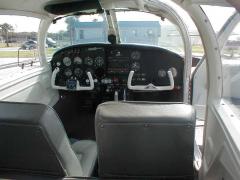
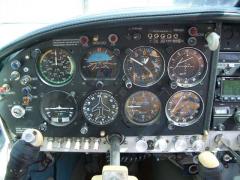
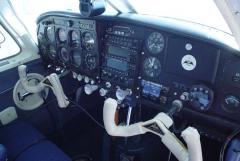
A collection of early Mooney panels that have been updated.
-
-
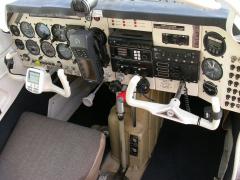
From the album: Panel Mods
-
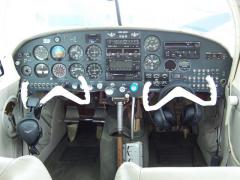
From the album: Panel Mods
-
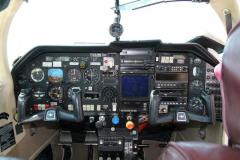
From the album: Panel Mods
-
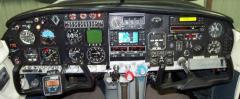
From the album: Panel Mods
-
From the album: Panel Mods
-
From the album: Panel Mods
-
From the album: Panel Mods
-
From the album: Panel Mods
-
From the album: Panel Mods
-
From the album: Panel Mods
-
From the album: Panel Mods
-
From the album: Panel Mods
-
From the album: Panel Mods
-
From the album: Panel Mods