

_Jim
-
Posts
4 -
Joined
-
Last visited
_Jim's Achievements
")

-
Beech Baron down with 2 fatalities - N585CK
_Jim replied to hubcap's topic in Mooney Safety & Accident Discussion
I found this article instructive as to icing:, https://itd.idaho.gov/wp-content/Aero/Publications/RF/2014/RF_Winter_2014.pdf Of note was the author's mention of this (brief excerpt follows): "Another common cause for icing, in temperatures above freezing, is Bernoulli’s Principle. Remember, airplanes fly because of the drop in air pressure that occurs when air accelerates over the top of the wing, creating high pressure underneath the wing. The drop in air pressure over the top of the wing is accompanied by a drop in temperature. If the drop in temperature is enough, the precipitation that impacts the leading edge of the wing may flow aft and later freeze. For these reasons, icing conditions are defined as OAT of less than +5°C and visible moisture. Visible moisture is clouds, fog, rain, snow or any other precipitation. These conditions are conducive to structural ice on aircraft.. ..." The author also cites a NASA video titled "NASA Tailplane Icing Video Glenn Research Center" in which they show wind tunnel testing with an airfoil undergoing icing. A web search will point out this video's URL on YT. -
Beech Baron down with 2 fatalities - N585CK
_Jim replied to hubcap's topic in Mooney Safety & Accident Discussion
The plot above shows the temperature and dewpoint being equal up past 8,000 feet at the site where the radiosonde balloon was launched ... the dew point temperature is a lot lower once the 700 mbar altitude is reached. At 8,000 ft the temp and dewpoint are about 2.5 deg C., cold enough that icing due to the Bernoulli effect (low pressure over the wing airfoil lowering the temperature) could and likely would form ice. Edit: The green and red lines converging means a nearly or evolving saturated atmosphere, RH going to near/at 100%, due to mist, fog. -
Beech Baron down with 2 fatalities - N585CK
_Jim replied to hubcap's topic in Mooney Safety & Accident Discussion
Let me excerpt just the part of interest - the altitude and temperature plots. I don't know how this will turn out, but I'll give it a try-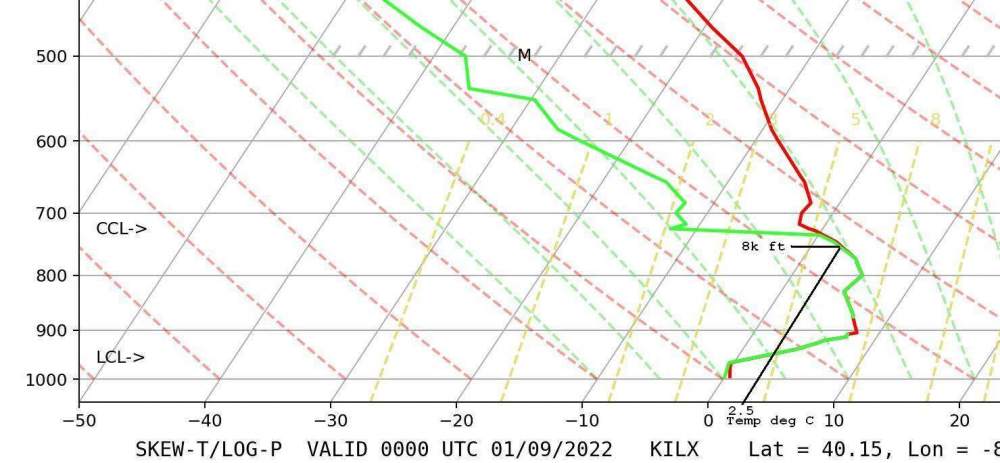
-
_Jim joined the community
-
Beech Baron down with 2 fatalities - N585CK
_Jim replied to hubcap's topic in Mooney Safety & Accident Discussion
I would suggest that anybody wishing to fully research this should look at the 00:00UTC ILX SKEW-T diagram. Radiosondes are normally released twice daily, at 0000 and 1200 UTC. The baro pressure at 8k feet is roughly 750 mbar on this skew-t diagram:
