
Scott Dennstaedt, PhD
-
Posts
437 -
Joined
-
Last visited
-
Days Won
3
Content Type
Profiles
Forums
Blogs
Gallery
Downloads
Media Demo
Events
Everything posted by Scott Dennstaedt, PhD
-
How about that...a SIGMET for severe turbulence prompted by PIREPs from two single engine aircraft. Normally it takes heavy metal to get a forecaster's attention before they issue a SIGMET.

- 1 reply
-
- 1
-

-
Yes, watched that last night. It was fairly interesting, but lost interest pretty quick. The balloon pilot, Amelia Wren, was fictional. Not sure why they couldn't have made it more true to the actual events, but that's Hollywood, I guess. I am familiar with James Glaisher. His primary goals/accomplishments in meteorology was in the measurement and study of the dewpoint.
-
 The GLMP was extended from 25 to 38 hours. See https://sats.nws.noaa.gov/~glmp/glmp_expr.php for ceiling and visibility. I've been using GLMP for over a decade and preferred this over any other automated ceiling/visibility forecast. They've really made some significant improvements over the years. No, it doesn't go out to 72 hours like the GMOS. Once you get beyond about 36 hours, the accuracy drops off incredibly fast. In fact, you can also see this also on aviationweather.gov here. The ceiling and visibility forecast for the GFA is from the GLMP product.
 -
The NWS discontinued the GMOS product. They are moving toward a more interactive solution that you can find here. Unfortunately, they don't provide a forecast for ceiling and visibility as of yet, but I do know it's on their list. Check back in a couple years. The GMOS graphics were not on an operational server and these efforts are always on the budget chopping block these days. Already mentioned is the GLMP forecast which provides a much higher temporal and spatial resolution and is updated hourly...although it only goes out to 38 hours. The GMOS forecast for the GFS was only updated every 6 hours and the NAM every 12 hours. I've had the GLMP on my website for more than a decade.
-
Here's an extreme turbulence pilot weather report at FL290 courtesy of a split flow regime. GAD UUA /OV GAD025040/TM 1945/FL290/TP E175/TB EXTRM CONS CAT/RM NO INJURIES NO DAMAGES ZTLFD More details here and a lesson on clear air turbulence using the Skew-T.
- 1 reply
-
- 2
-
-
The problem with better weather products
Scott Dennstaedt, PhD replied to ArtVandelay's topic in General Mooney Talk
Agreed. The Windy app has a very slick depiction of the winds. Pleasing to the eye...could look at it all day, but it's not what *I* use to make good decisions. -
Effective Tuesday, January 28, 2020, at 1200Z, the NWS office in Miami, FL will begin TAF service for KBCT, Boca Raton Airport; KPMP, Pompano Beach Airpark; and KHWO, North Perry Airport. After that date, routine and updated TAFs will be issued for the three airports 24 hours a day until Tuesday, February 4 at 0000Z.
-
XM Weather - Storm Cell Trend Line
Scott Dennstaedt, PhD replied to alextstone's topic in General Mooney Talk
Your question is why I picked one vendor, namely, GP to emphasize the answer ultimately depends on the vendor. There isn’t a standard and the vendor is free to display this in any way they choose and that should be documented in their pilots guide. If you read the post you quoted, the answer is documented there. Just to be clear, I did write that post but am no longer associated with that organization. -
XM Weather - Storm Cell Trend Line
Scott Dennstaedt, PhD replied to alextstone's topic in General Mooney Talk
Is this displayed on Garmin Pilot? -
HISTORIC DECLINE IN FATAL ACCIDENT’S
Scott Dennstaedt, PhD replied to Danb's topic in Miscellaneous Aviation Talk
I would be careful to read too much into this...especially as a "trend" of sorts. Although I had been doing a ton of weather training and major improvements to ForeFlight weather during that time. ;-) There was also a drop in 2006, 2008, & 2010, but an equivalent increase occurred the subsequent year. What these stats don’t include are weather related *incidents* that don’t get reported as accidents, but are still just as concerning, especially those that involve loss of control or VFR into IMC which still kills more pilots than icing, turbulence and thunderstorms put together. Yes it’s good to hear less of these are resulting in an accident, but the research I’ve been doing for my PhD says the number of weather related incidents has not been declining. An incident would be something like a loss of control due to airframe icing resulting in a hard landing (that didn't cause damage or enough damage to be reported). -
No, it's just the interaction with land that is starting to make the storm less organized. Here's a great visualization:
-
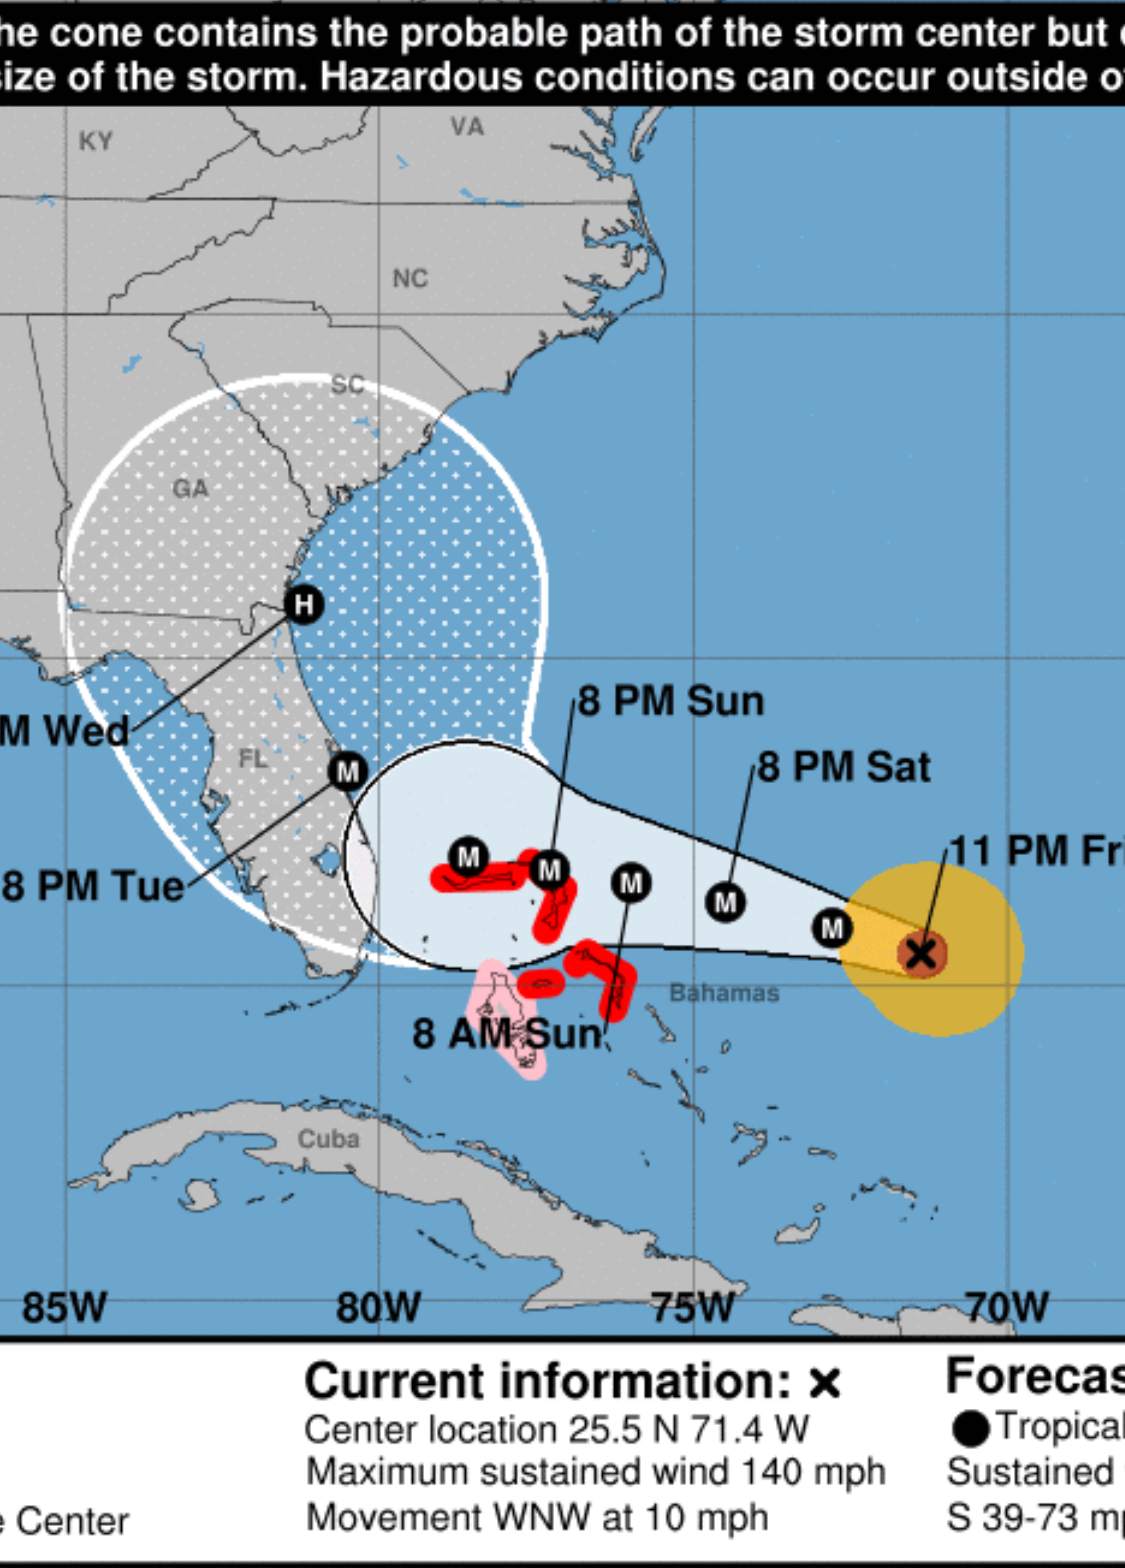
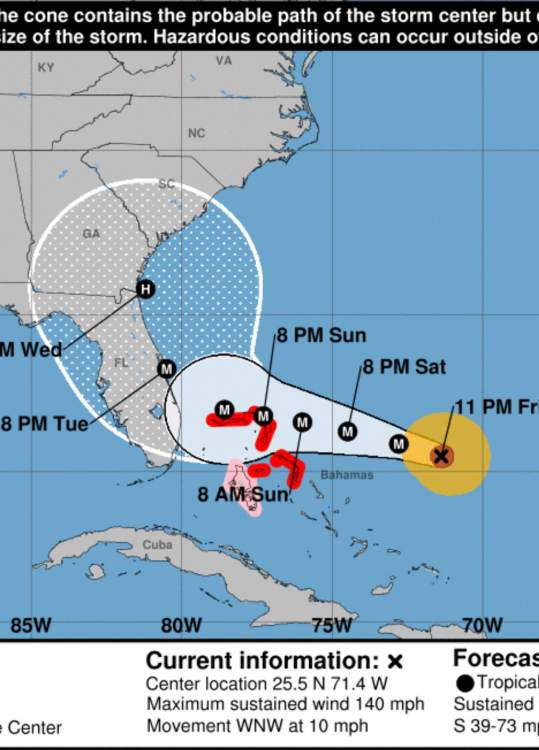
As I've said from the beginning, Dorian had some unique characteristics which has made it a difficult storm to forecast. Now the storm is off the coast of southern Florida and is nearly stationary as a category 4 hurricane.
-
Very sobering. From the NHC. “The distinct eye of powerful Hurricane Dorian is moving over Great Abaco. The latest wind and pressure data from an Air Force reconnaissance plane just before the eye hit the island indicated that the winds reached 160 kt, which is the initial intensity for this advisory. It is not very often that we measure such strong winds. The minimum pressure measured by the plane was 910 mb.”
-
Latest forecast. Somebody needs to teach Dorian to read the forecast. Must be a Republican storm...seems to be always leaning to the right.
-
Jim, You are right on the money. This isn't a storm to full around with...as I mentioned in my post, there's still a risk of storm surge in Florida as it passes offshore. Of course the amount of surge will depend on just how close it gets. What worries me though is that this wasn't be best performance by the NHC. You evacuate the entire state of Florida, but it barely has an impact (assuming the current trends continue). The next storm, will people heed the warnings for the next major storm to impact the area? Being in this business I can say for sure that there are a ton of variables that need to be considered and there's a ton of data to look at in a limited amount of time. Just shows we have a long way to go before we can understand how to predict the complexities of Mother Nature.
-
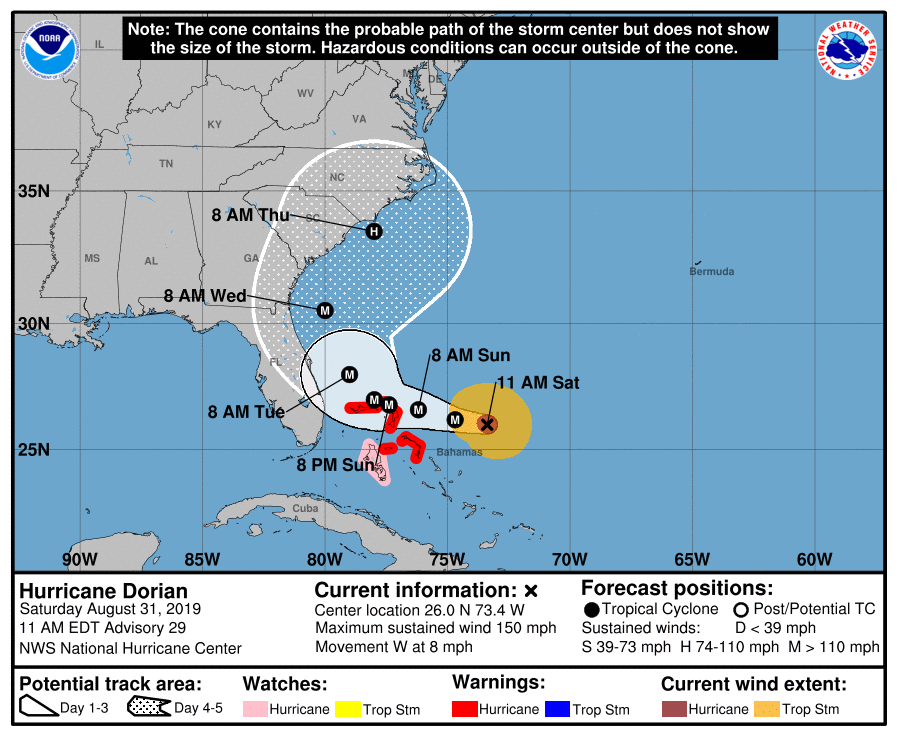
The storm continues to slow down as I suspected and a direct landfall in Florida isn't as likely. This has given the chance for the ridge to the northeast to weaken allowing Dorian to take a much earlier turn to the north-northwest. Still a major hurricane, the center of circulation will remain offshore based on the latest guidance from the NHC. As I said earlier, this storm had some odd characteristics from the beginning and has been difficult to forecast. There is still a significant threat of storm surge as this category 4 storm passes along the southeastern U.S. from south-central Florida through the Carolinas. Don't let your guard down yet. From the NHC - "The track guidance for this part of the track is tightly clustered, and the new forecast track is near the ECMWF, UKMET, and HCCA corrected consensus models. The track forecast becomes much more problematic after 48 h. The global models the NHC normally uses, along with the regional HWRF and HMON models, have made another shift to the east to the point where none of them forecast Dorian to make landfall in Florida. However, the UKMET ensemble mean still brings the hurricane over the Florida peninsula, as do several GFS and ECMWF ensemble members. The new track forecast for 72-120 h will be moved eastward to stay east of the coast of Florida, and it lies between the old forecast and the various consensus models." Looking back at earlier runs of the models, it was amazing to see that the GFS had a pretty good handle on this storm early on. This run below was from 06Z on August 28th. I think the ECMWF had a better handle on slowing down the storm, but tended to take the track much further to the south. The ECMWF had a totally different solution taking it pretty far south and then into the Gulf.

-
Appears the scenario I described above is becoming more likely with the potential of the storm remaining off shore.
-
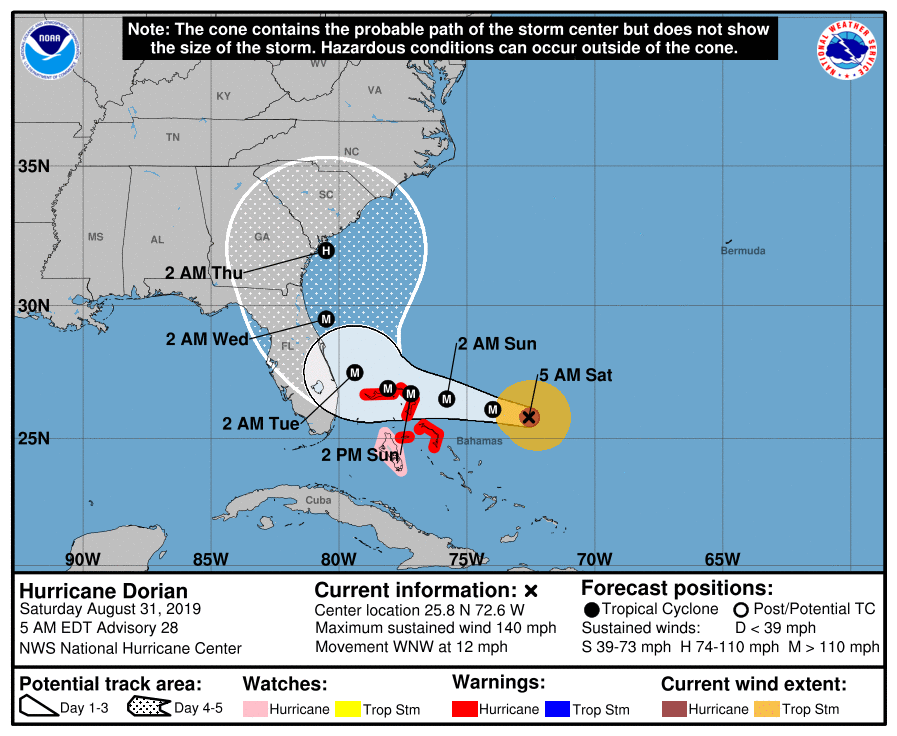
Been watching Dorian has it has shown some odd characteristics and has been somewhat difficult to forecast. I mentioned on another board that I expected to see Dorian slow down considerably before turning to the northwest-north as it approaches and makes landfall in Florida. What I've noticed from a few days ago, all of the model guidance has been wanting to take this storm to the coast of Florida a lot faster than it has been actually moving. That's good for evacuations. It was originally expected to make landfall in Florida as a tropical storm early Sunday morning, but now is looking like Tuesday morning as a category 4 hurricane as you can see by this loop...I expect this trend to continue such that by later today or tomorrow the forecast will be pushed back even more as the system continues to slow. That means Dorian could take an earlier turn to the north as that ridge over Bermuda is expected to retreat creating an even worse situation if it stays just along the coastal regions as it moves north. Depending on how far the storm remains off shore would determine how quickly it would weaken, but it would batter a much greater length of the coastline and keep the fuel for the storm pumping in from the warm Atlantic waters dumping more precipitation as it drifts north. PLEASE NOTE: This is just one scenario I am considering myself and not the official forecast from the NHC. But it's likely the worst case scenario.
-
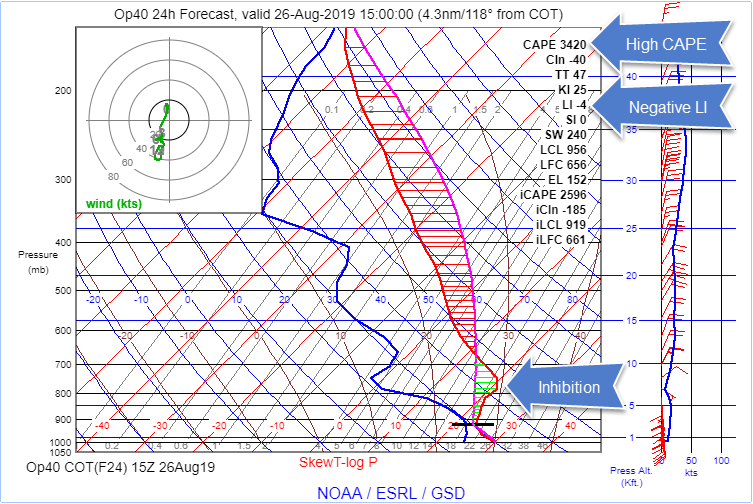
The problem with the lifted index is that it is highly dependent on what is happening at 500 mb. With low topped convection or a meager lapse rate at 500 mb it can be very misleading as to the threat. In fact, the SPC rarely mentions it. A better index is Convective Available Potential Energy or CAPE which provides a more comprehensive view of how the atmosphere is poised. Therefore, from an instability perspective it is the preferred index by most forecasters. It is true, however, that when CAPE is large, the lifted index will be negative. I like to use the lifted index when it is highly positive (greater than 15). You know it’s likely to be great flying weather. Also, these convective indices only show there is convective instability not that convection will form. You can have a lifted index of -12 and CAPE over 5000 and have zero chance of thunder. I know there are some apps like Aerovie that put out that your route will encounter high CAPE regardless of whether or not there’s any chance of convection. Personally I think that’s not a good approach. Here's an example for tomorrow morning. The lifted index forecast in southern Texas below shows LIs in the -6 to -10 range (fairly significant). However, the SPC is not forecasting any convection for tomorrow morning in this same area. Even though there's a negative LI (-4) and high CAPE (3420), there's also a huge hill to climb called convective inhibition (-185) as you can see from this forecast sounding for tomorrow morning. The other aspect of lifted index or CAPE is that there are multiple flavors. Most pilots use surface-based indices which don’t always catch the potential for elevated convection which is often embedded. So it’s important to know what index you are using and it’s limitations.
-
It's rare to see such persistent IFR conditions during late August in the Charlotte area that are not associated with convection as seen in the HREF forecast below for probabilities of ceilings below 2,000 ft. Today was that day to go out and shoot some IFR approaches in relatively smooth air. For more on what is causing this summertime anomaly, see my recent blog post.
-
There needs to be some kind of weather reporting equipment on the field. I don't know of any U.S. airport with a TAF that doesn't have some kind of weather reporting (although it doesn't have to be full time weather reporting) on the field.
-
Usually commercial service or EMS requirements. And I'm sure there are some politics in all of this...but you didn't hear me say that!
-
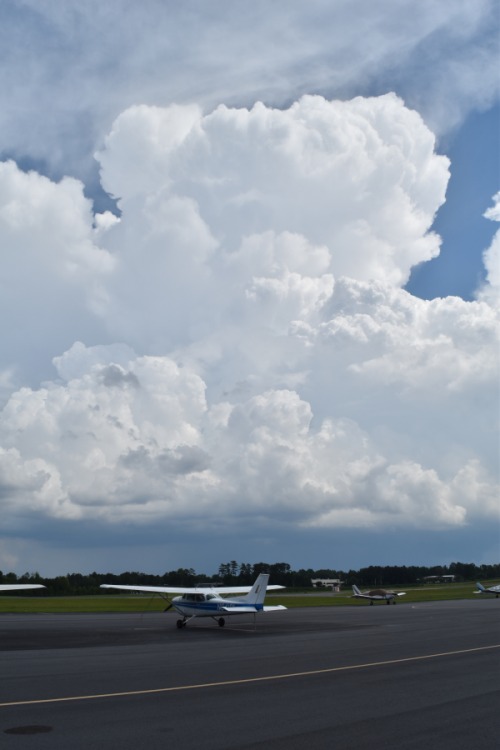
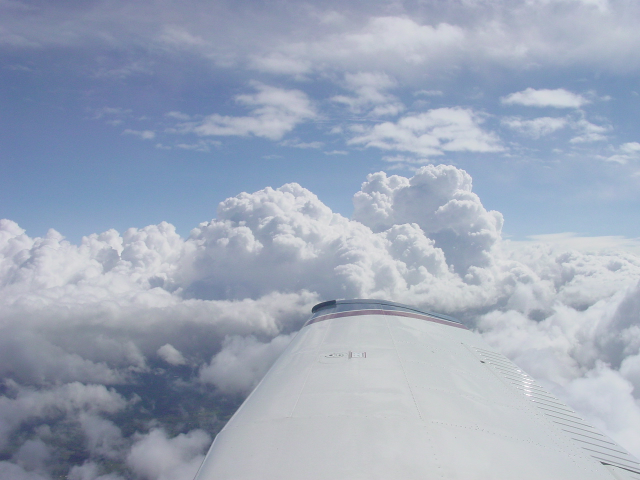
Robert, Thanks for taking that Skew-T course! Lots of good information there. There's no precise measuring stick when it comes to knowing what's safe to fly under (or over). I covered this in my Inflight Hazard Avoidance Strategies live webinar I did several months ago (it was recorded and can be purchased here). Of course, I could have spent the entire 4 hours talking about this one specific issue, so it only provides some basic guidance. So without writing a book, here are a few important things to consider. Rule #1: Pay considerable attention to deep, moist convection with a very high base (again, there's no precise measuring stick, but I generally start to get concerned with bases of 8,000 or more). Rule #2: Any towering cumulus (deep, moist convection) that has reached the tropopause (they start to flatten at the top and lose that cauliflower-like appearance), then avoid flying under those. Rule #3: When the cloud is taller than you can fly your airplane and is about 4-5 times tall as it is wide at the base, then it time to start thinking about flying around it, not under it. Rule #4: Be careful of deep non-precipitating clouds when there are nearby clouds producing showery precip or thunderstorms. Are there lots of cells in the area with some producing precipitation? Generally speaking, if these are single billowing clouds sprinkled down a ridgeline and none of them are generating precipitation, then they are likely harmless to fly under. But if you see some of them producing precipitation and they have high bases, see rule #1. Or if you begin to see them hit the tropopause (they start to flatten out at the top), then I would remain clear - see rule #2). Rule #5: If you cannot easily decipher what's on the other side of the cloud because it's just too big and obscuring the area, then it's not a good idea to fly under it. See below. These clouds below are fine to fly under. Not enough depth and the height to width ratio is below 4 or 5:1. Hope this helps.
-
Effective Tuesday, October 22, 2019, at 1800Z, the NWS office in Reno, NV, will begin Terminal Aerodrome Forecast (TAF) service for Minden-Tahoe Airport (KMEV) in Minden, NV.
-
Oshkosh Summary - what did you learn?
Scott Dennstaedt, PhD replied to Seth's topic in Miscellaneous Aviation Talk
Yes, that would have been my presentation if you attended one at 8:30 am on Thursday.